

Clustering spatial data without ML to find homogeneous areas
This is an interesting discussion on managing spatial data with machine learning. I found this fascinating given the amount of spatial data collected by our (U.S.) government. The tools available are fun to explore. Be sure to click on the 4th image to open the interactive dashboard.
– Jeff
By Björn Hartmann for Medium
Nov 29, 2017
Learn how to cluster spatial data without typical ML methods
Just recently, I was asked how I would cluster some data. Usually, this is not a big deal as there are many algorithms dedicated to this. But this dataset was different. In particular, the dataset contained spatial data and proved to be difficult to estimate with popular machine learning algorithm.
Spatial data refers to data with geographic information like coordinates. As it would not make sense to include them as explanatory variables in a ML model, we need another method to consider them. This is the reason for this article where I suggest one approach to deal with them.
In the end, I came up with a solution that might be interesting for you. But let’s consider a practical example. Note, that this is a hypothetical example. It imposes some nice features, and you can reproduce it as the data is publicly available at DB Open Data.
Example:
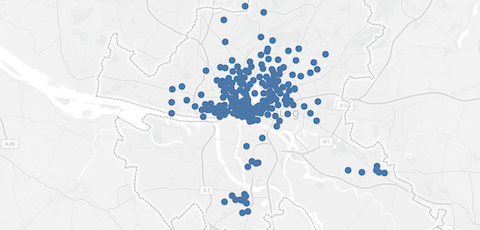
The bike-sharing provider StadtRad in Hamburg offers bicycles at 212 locations. Users can take a bike at any station and return it at any other station. In order improve the relocation process and to target new customers, StadtRad might want to know if there are homogenous areas in which many trips occur. More specifically, it could ask if we can cluster those stations into several groups.
How can we cluster these bike-sharing stations?
The reason why I do not recommend using the k-mean algorithm is that this method is based on the distance between data points. So it tries to find clusters by minimising the distance between stations and a cluster’s center. As bike-sharing users, however, are more likely to ride a couple of kilometers instead of returning the bike at the next station, I do not want to consider the distance between two stations.
Finally, nearby stations might be used by different customer groups with other travel patterns. Thus, the nearest-neighbor method might suggest biased results. An issue I will address later.
To consider the number of trips between any two stations, we can use a network approach. A network consists of nodes and edges. In this example, stations are the nodes, and the routes between two stations are the edges. A benefit of networks is that we can weight the edges with the number of trips on a route and consider their direction.
As such, we can quickly illustrate this network with a tool like Gephi. Each dot represents a station and each line a route:
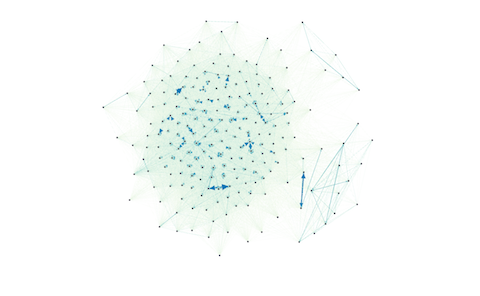
This network illustrates the operation of the bike-sharing operation StadtRad in Hamburg. Each dot reflects a station and each line indicates the number of trips between two stations.
To create the graph above, I computed a list that contains the number of trips on each route and imported it into Gephi. With 212 stations, there are almost 45.000 possible routes (=212²). Customers, however, took (only) 29.712 routes.
How to cluster the data in Gephi
Now follows the crucial part. I asked Gephi to cluster the data using the modularity class. This algorithm does all the magic for you. It clusters the stations considering the routes and their weights. Originally, this algorithm is designed to detect communities in networks. It tries to find clusters that have strong connections among their nodes and weak connections across clusters.
Gephi’s visualization can give you a first impression of the results, but it does not consider the geographical location of the stations. As such, I rather recommend another tool to visualize and validate the results.
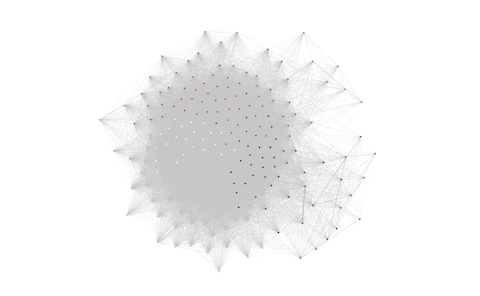
The results after clustering. As Gephi does not consider the geographical coordinates, use another tool to map the results.
Results
In Tableau, I joined the coordinates of all stations to Gephi’s results and checked the clustering. Tableau maps the stations to their exact location and computes the number of trips between and within clusters:
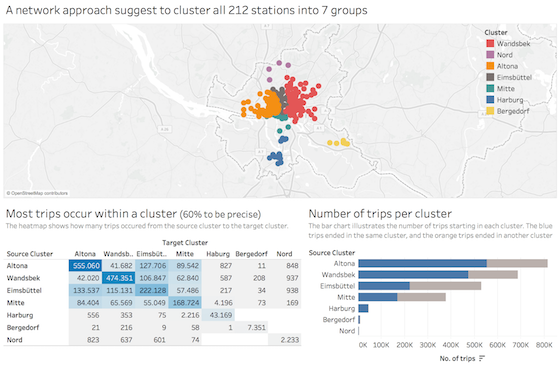
Click on the image to open the interactive dashboard.
Note, that I have not provided Gephi any coordinates. Based on the number of trips between stations, only, it found seven very homogeneous areas.
The heat map shows that 60% of trips occurred within these clusters. It provides detailed information on the number of trips between any two clusters. Of course, you can estimate more or fewer cluster if you like, but for me, seven seems to be a good fit.
Reason against nearest-neighbor algorithm
What I found interesting, is that Gephi assigned certain stations to the “correct” cluster, even though they seem wrong in the first place:
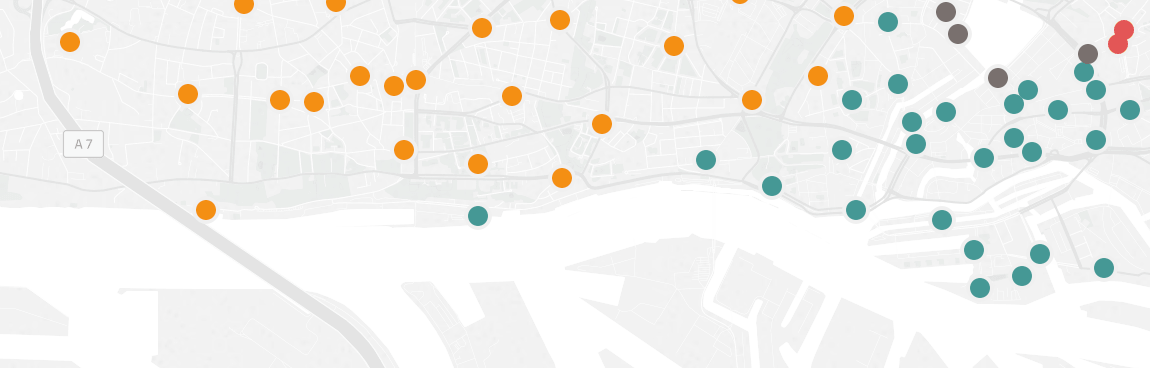
Although the green station seems to be in the wrong cluster, it is reasonable considering it is a popular station for tourists that drive along the Elbe river to the Elbphilharmonie.
Do you see the greenish station that is surrounded by orange stations? With the nearest-neighbor algorithm, it would be in the orange cluster, too. Considering that most trips to and from this stations come from stations close to Elbphilharmonie (right along the Elbe river), it seems a good fit. Note, this is a popular route for tourists. Trips from the orange stations, however, end more often in Altona.
The nearest-neighbor algorithm, however, would have failed to consider these travel patterns.
TL;DR — Summary
- When clustering data points with a spatial relation and relationships between those data points, consider describing your data with a network
- Compute the modularity class in Gephi
- Visualize and validate your clusters in another program (e.g., Tableau)
This article was first published Nov 29, 2017 on Medium.com: TowardsDataScience.
No Comments